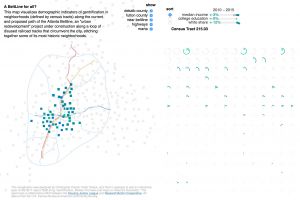
This map visualizes demographic indicators of gentrification in neighborhoods (defined by census tracts) along the current and proposed path of the Atlanta Beltline, an "urban redevelopment" project under construction along a loop of disused railroad tracks that circumvent the city, stitching together some of its most historic neighborhoods.

The Local Data Design Lab is focused on bridging the substantial divide between two complimentary, but largely disconnected areas of work: data studies and data visualization. The first is an area of scholarly inquiry that has emerged recently in response to the phenomenon of Big Data and seeks to make sense of data from a social perspective. The second is a form of design practice, which produces informative and expressive interfaces to data. It is influenced by, but more publicly oriented than the sub-field of computer science called information visualization. The goal of this crossover research is to develop new models of visualization that inform and engage, but also prompt reflection on the nature of data and the work that they do. Our projects take on a variety of interrelated forms:
- Empirical data studies that can inform practice in data visualization
- Data visualizations that support or embody our studies of data
- Hands-on workshops that enable others to engage critically with data
Beyond its impact in scholarship and practice, the research of the Local Data Design Lab has the potential to improve data literacy in the public realm and is rapidly finding purchase in education, journalism, advocacy and planning-all of which struggle to keep people informed in the face of Big Data.


